New hiring metrics to dive into your hiring process
The Company insights page as well as the Job insights page can both help reflect on your hiring process and uncover bottlenecks. With additional filtering, new hiring metrics, and a simpler date picker you can get granular view on how candidates are progressing through your hiring process. Let’s get into the new metrics.
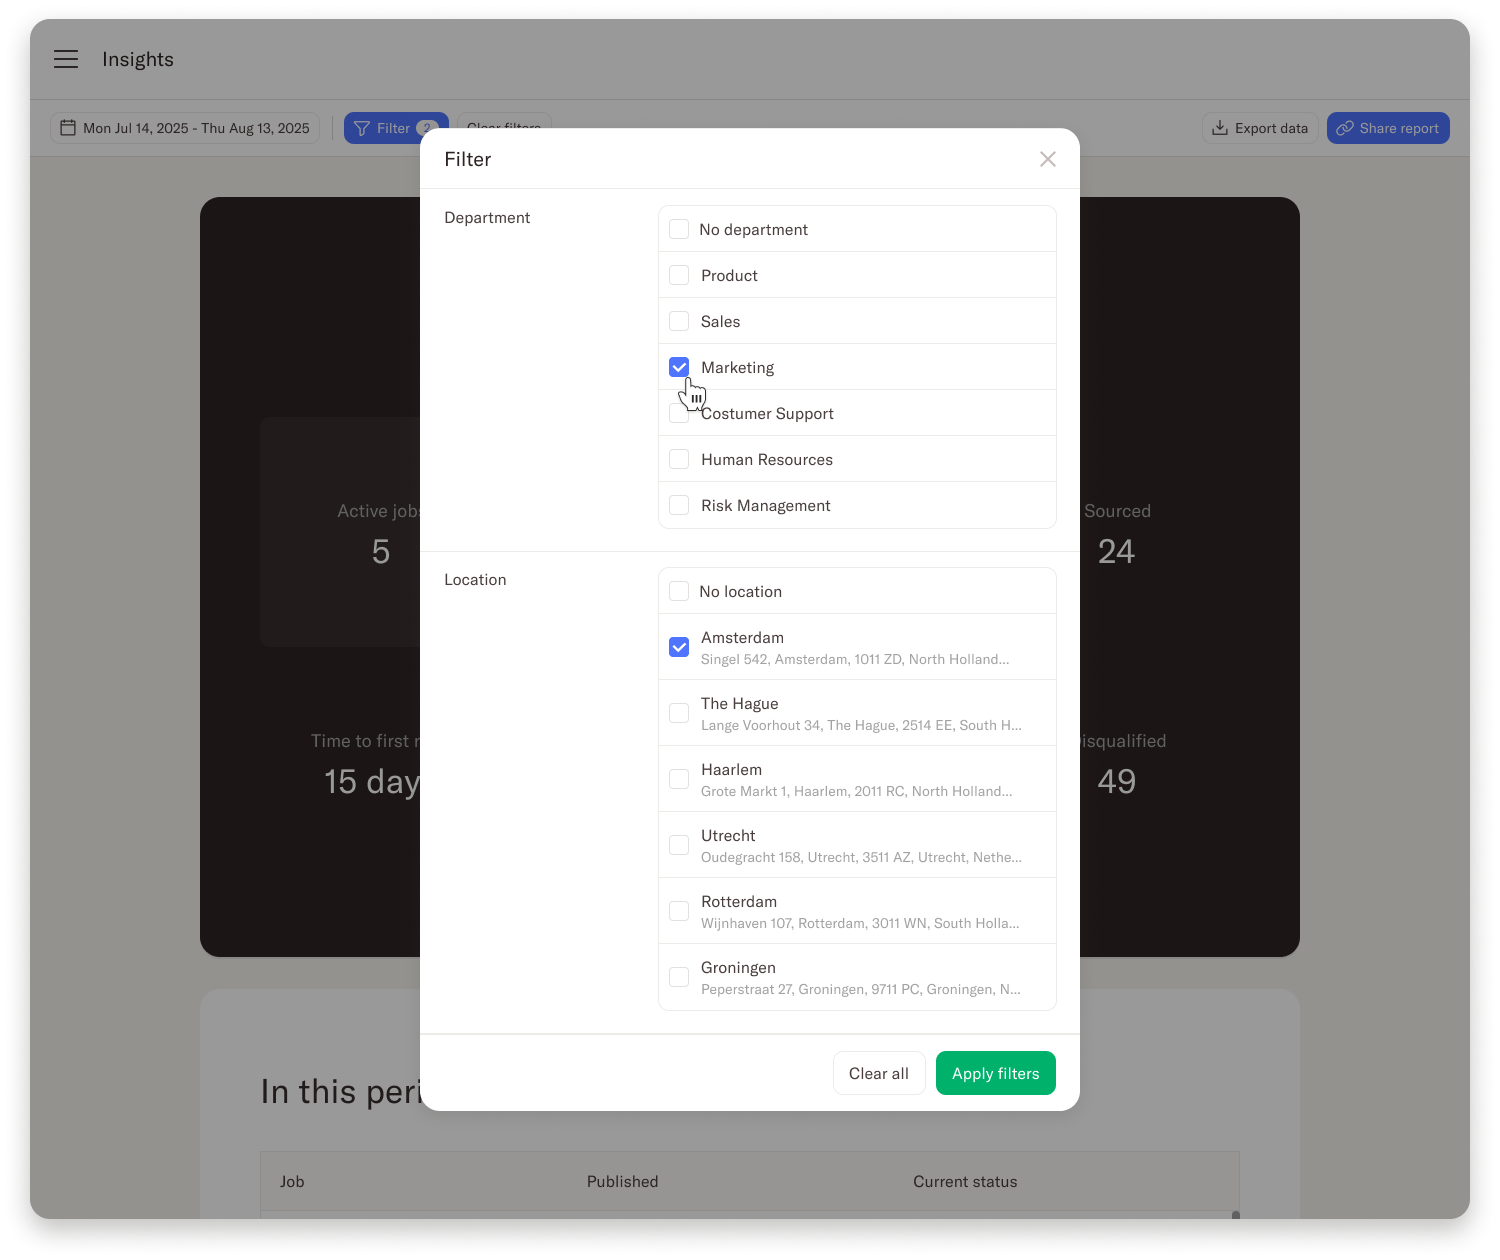
New location and department filters
You can now filter the Company insights page on Departments as well as Locations. This allows you to review the hiring process in a more detailed way and spot where the process went well, and where you might need to optimize.
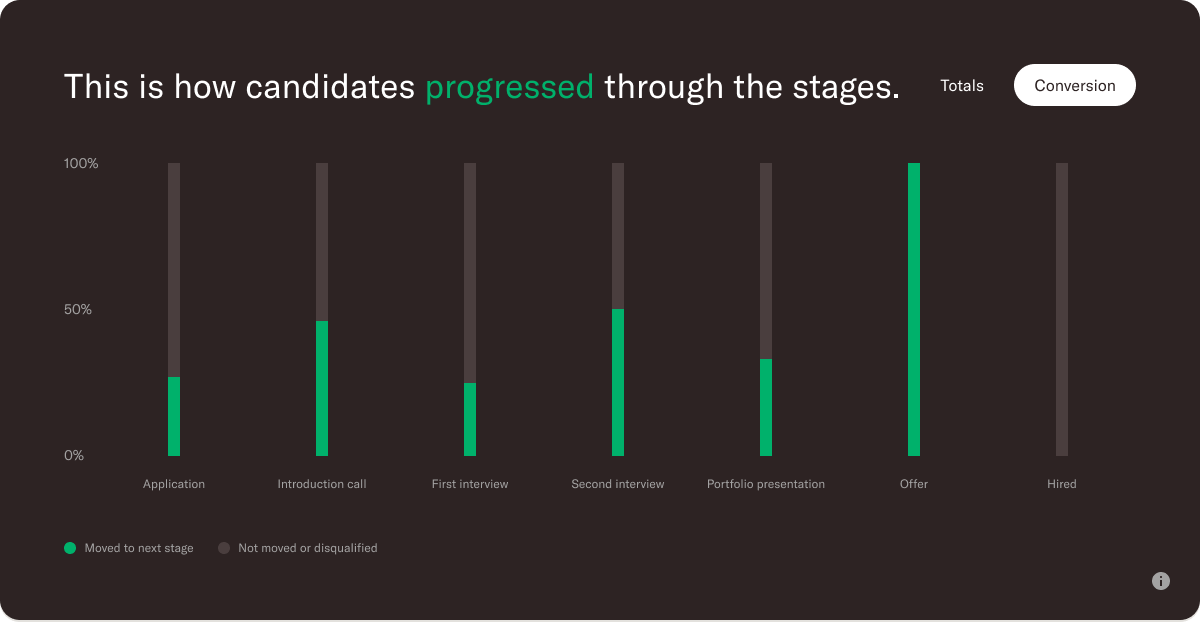
Hiring pipeline & conversion
A completely new view is the hiring pipeline which shows you exactly how candidates are moving through the hiring process. It shows the number as well as the percentage of candidates progressing through the stages, and those that are disqualified or that have not moved at all.

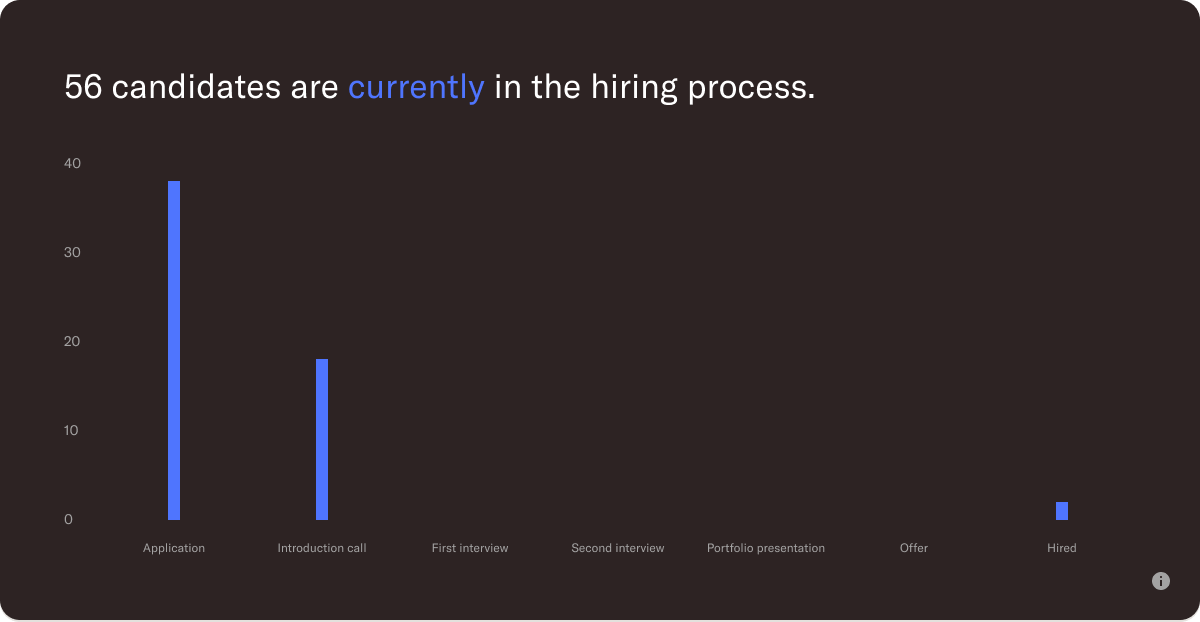
Candidates in the hiring process
A new section on the Insights page for the Job insights is the “Candidates currently in progress”. This is a visual representation of where candidates currently are in the hiring process. This view can help identify where an action is required if you’re checking the Insights report halfway of the hiring process.
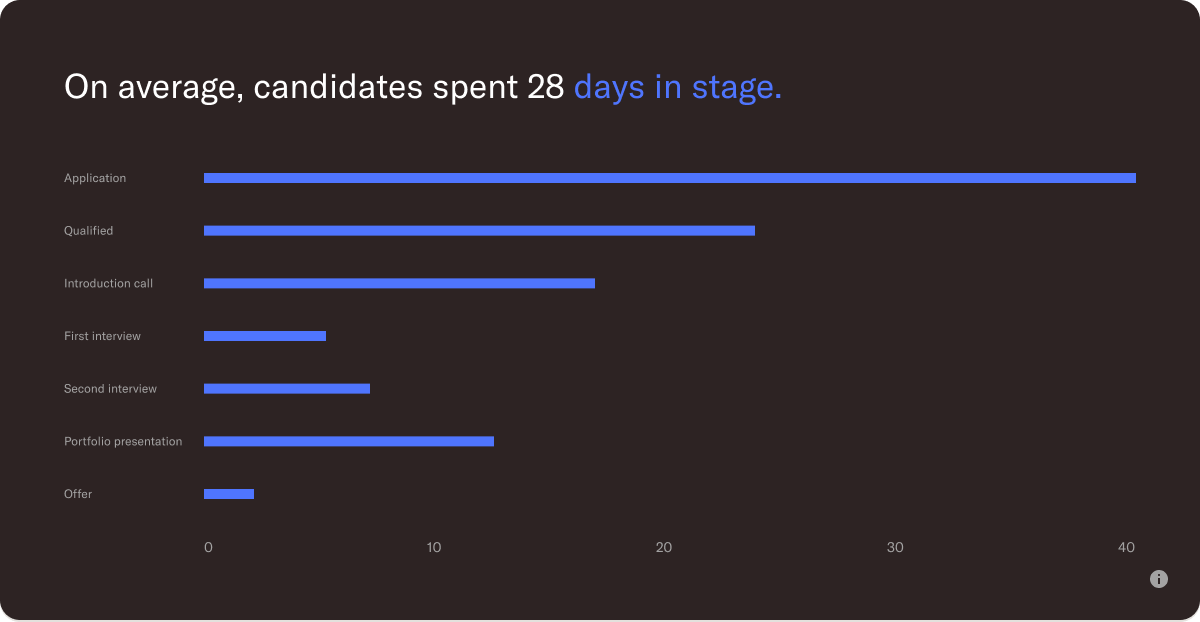
Time in stage
The time in stage hiring metric shows the average, minimum, and maximum number of days candidates have stayed in each stage. Checking this metric helps spot bottlenecks and delays, and learn where candidates are getting stuck. This will both help your team in the time they spent hiring, but also improve the candidate experience if you can take action.
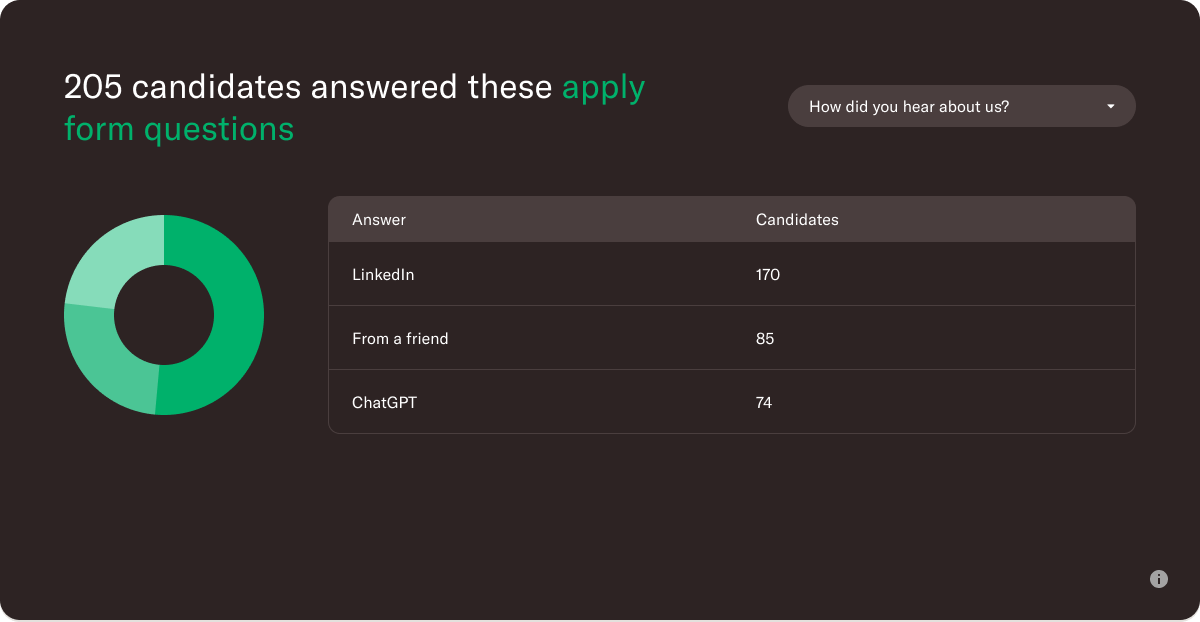
Apply form answers
Candidate answers to multiple choice questions are now shown visually in a pie chart. This is a great way to compare answers to questions like “Where did you find this job?” or “What is your preferred office setup?” and analyse the answers.
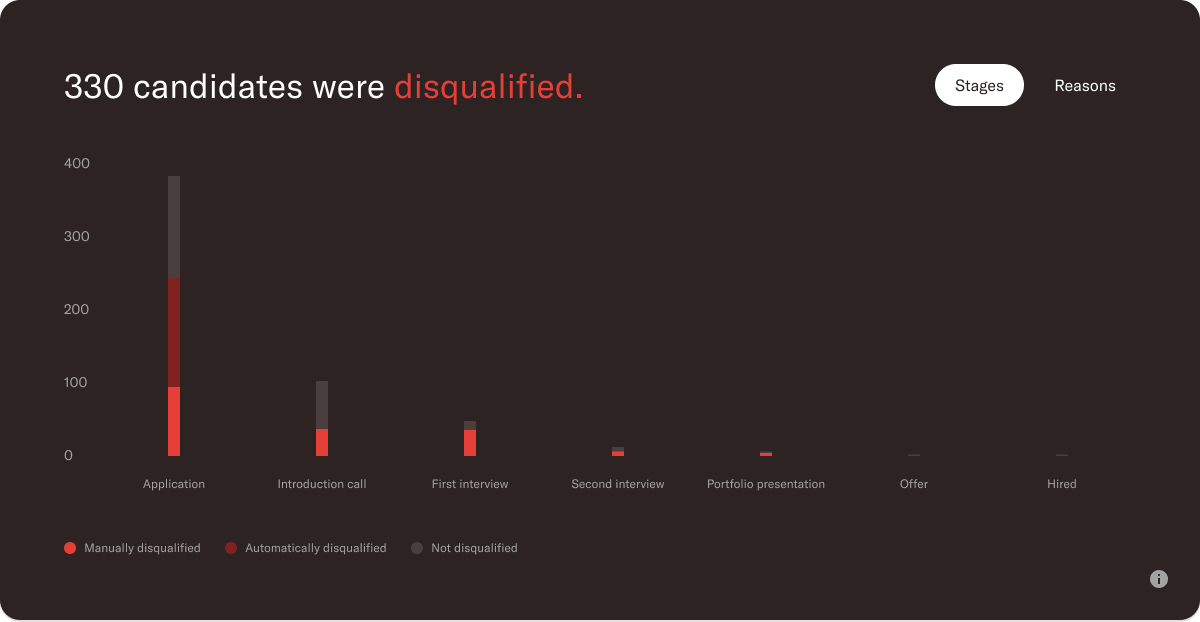
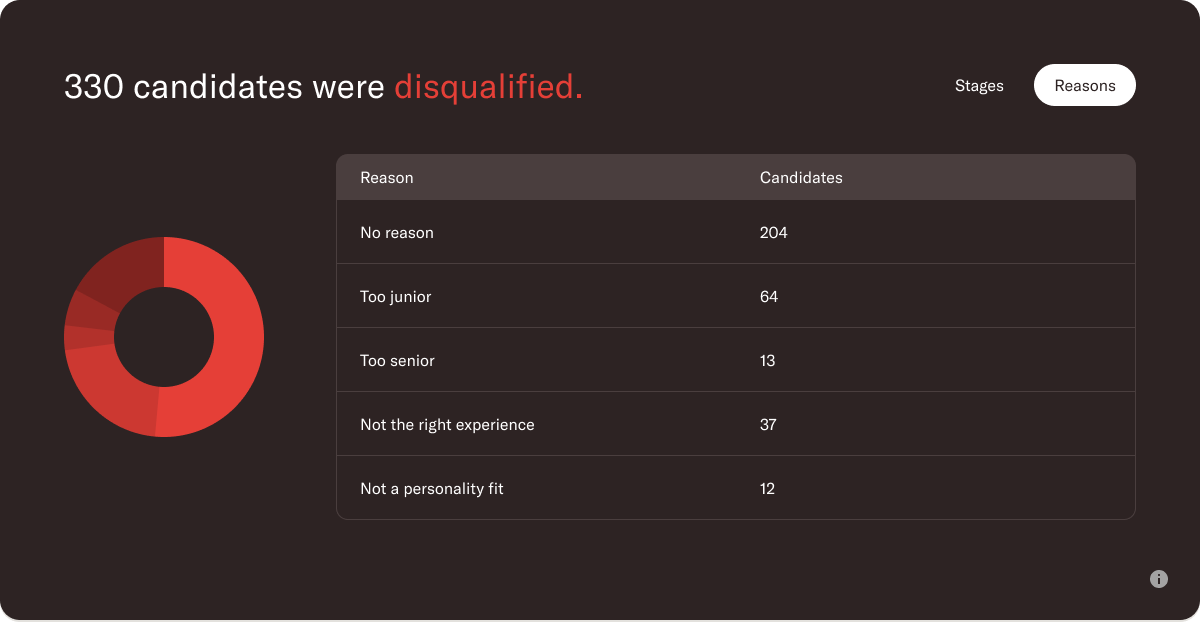
Disqualifications per stage
The Disqualifications per stage show you exactly where candidates were disqualified and also how they were disqualified. This view can help you gain valuable insight in the stage with the most disqualifications to set expectations for future roles, or improve screening questions at previous stages.
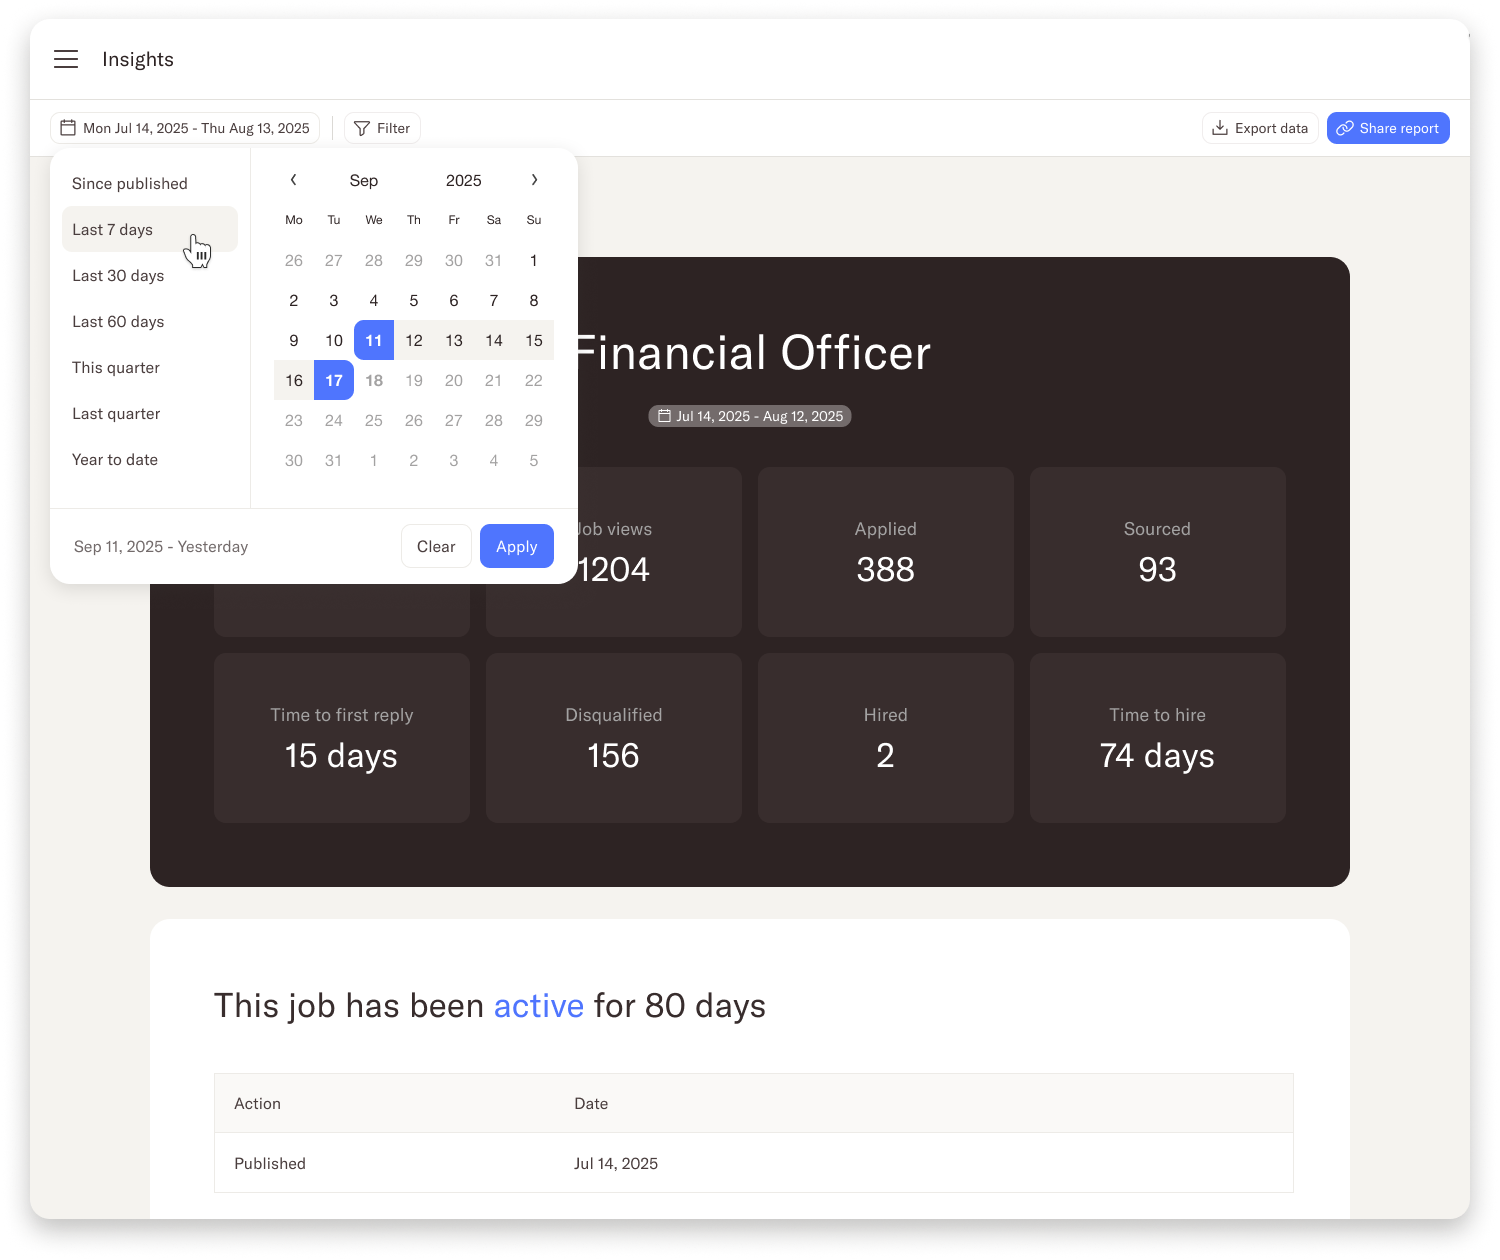
New date picker
It’s now a lot simpler to select the dates for which you want to check the Insights. You can use one of the suggested time frames such as the last 7 days or the last quarter, or you can select any two dates to show hiring metrics.
Updated candidate export
If you’re looking to create your own hiring metric dashboard, you can now export additional data to build your own graphs and tables. The export now includes the answers to the apply form questions, as well as the time for each stage.
We hope these new insights help you reflect and analyse your hiring process with your team. If you have any questions about these metrics, you can send a message to support@homerun.co